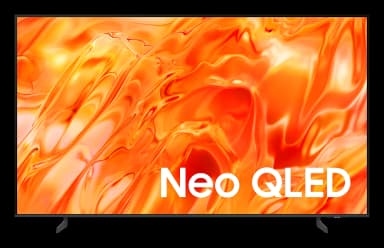
Neo QLED QN70H 4K Samsung Vision AI Smart TV vs Samsung LS03F
Samsung LS03F is the better TV for most people

Best for
- MoviesEither - too close to call
- SportSamsung LS03F
- GamingSamsung LS03F
Head to head
- Picture quality
- Motion
Samsung LS03F is ahead on motion: refresh rate 100 Hz against 50 Hz.
- Sound
- Smart features
- Connections
Samsung LS03F is ahead on connections: hdmi ports 4 against 3.
All specifications
Neo QLED QN70H 4K Samsung Vision AI Smart TV
Samsung LS03F
General
Operating System
Tizen
Tizen
Display
HDR
Yes
Yes
HDR Format
HDR10+
HDR10+
Refresh Rate
50 Hz
100 Hz
Resolution
3840 x 2160
3840 x 2160
Screen Size
55 in, 65 in, 75 in, 85 in
55 in, 65 in
Viewing Angle
Wide Viewing Angle
Wide Viewing Angle
Connectivity
Bluetooth
5.3
5.3
Ethernet
Yes
Yes
Wi-Fi
Wi-Fi 5
Wi-Fi 5
Sound
Dolby Atmos
–
Yes
Speaker Configuration
2ch
2.0.2 CH
Ports
Audio Output
20 W
40 W
HDMI Ports
3
4
Optical Audio
Yes
Yes
USB Ports
2
2
Build and size
Dimensions
1232.1 x 708.8 x 25.7 mm
1237.9 x 708.8 x 24.9 mm
Weight
13.8 kg
16.9 kg
Installation
VESA Mount
200 x 200 mm
200 x 200 mm
Questions people ask
Which is better, Neo QLED QN70H 4K Samsung Vision AI Smart TV or Samsung LS03F?
Samsung LS03F is the better TV for most people. Samsung LS03F wins on motion and connections.
Which handles fast motion better, Neo QLED QN70H 4K Samsung Vision AI Smart TV or Samsung LS03F?
Samsung LS03F is ahead on motion: refresh rate 100 Hz against 50 Hz.
Which has more connections, Neo QLED QN70H 4K Samsung Vision AI Smart TV or Samsung LS03F?
Samsung LS03F is ahead on connections: hdmi ports 4 against 3.
Which is better for sport, Neo QLED QN70H 4K Samsung Vision AI Smart TV or Samsung LS03F?
Samsung LS03F scores higher for sport.
Which is better for gaming, Neo QLED QN70H 4K Samsung Vision AI Smart TV or Samsung LS03F?
Samsung LS03F scores higher for gaming.
Scores are out of 10 against products released in the last two years, worked out from published specs. Prices are averages of what sellers quoted.